








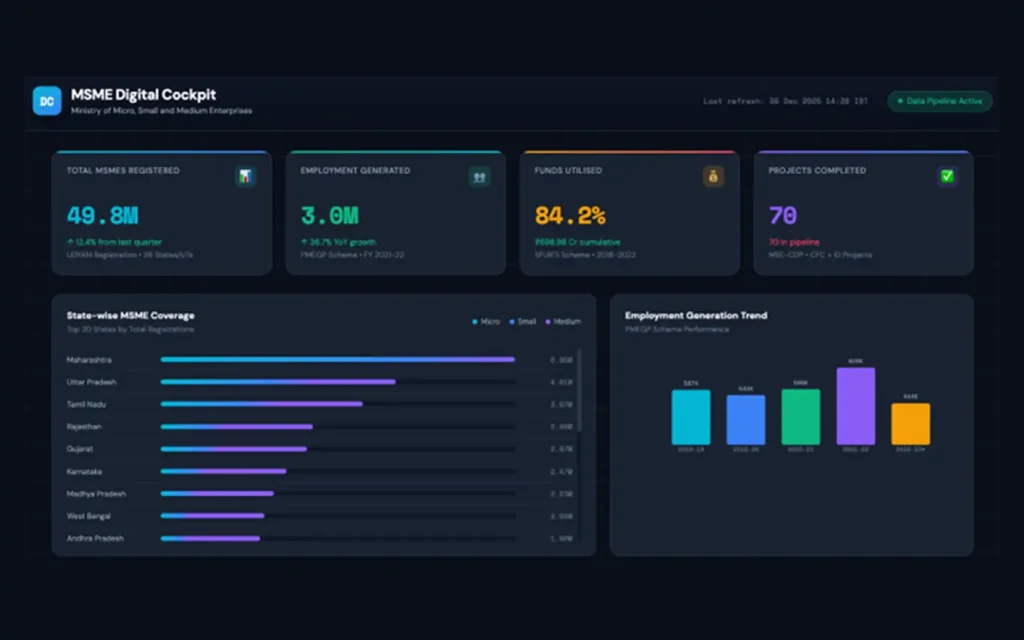
Real-Time Intelligence for Results-Based Governance
The Challenge
MSME schemes generate massive impact across India, but fragmented data systems make it difficult to answer critical questions:
- Which schemes are delivering results on the ground?
- Where are implementation bottlenecks slowing progress?
- How do we spot delivery risks before they become crises?
- Can we prove outcomes to Parliament and citizens with confidence?
The Digital Cockpit solves this with a data.gov.in-first, transparent, audit-ready platform.
What the Digital Cockpit Delivers
Single Source of Truth
Consolidate performance across all MSME schemes—PMEGP, CGTMSE, MSE-CDP, SFURTI, ZED, and more into one authoritative dashboard with drilldowns from national to district level.
Real-Time Governance Intelligence
- Portfolio Scorecard: Monthly/quarterly snapshots across coverage, spending, delivery, and outcomes
- Scheme Dashboards: Track each program’s health with standardized KPIs and trend analysis
- State & District Views: Identify high-performers and lagging geographies instantly
- Early-Warning Alerts: Detect delivery slippage, anomalous spending, and outlier patterns before they escalate
Transparency & Accountability
Built on data.gov.in-first philosophy:
- All baseline data pulled from public open datasets
- Audit-ready monthly review packs with full data lineage
- Optional public transparency layer while maintaining secure internal operations
- Results-based governance readiness with standardized KPI catalog
Future-Ready Analytics
- Anomaly detection algorithms flag unusual spending or delivery patterns
- Predictive delivery risk modeling identifies schemes likely to miss targets
- Outcome attribution analytics link interventions to employment and enterprise outcomes
- Action tracking ensures follow-through on leadership decisions
Built on Trusted Government Data
Priority Data Sources (data.gov.in)
| Dataset | What It Provides | Cockpit Usage |
|---|---|---|
| UDYAM Registration (District-wise) | Daily updates on MSME registrations with LGD district codes | Coverage baseline, growth tracking, geographic drilldowns |
| PMEGP Performance | State/UT employment and enterprise creation under PMEGP | Jobs outcome proxy, program effectiveness |
| CGTMSE Guarantees | State-wise guarantee approvals, beneficiaries, and approved values | Credit facilitation health, scale trends, risk signals |
| MSE-CDP Projects | State/year-wise approved vs. completed projects | Delivery pipeline analysis, bottleneck identification |
| SFURTI Spending | Year-wise expenditure under revamped SFURTI | Spend efficiency, program scale monitoring |
| ZED Registrations | State-wise MSMEs adopting Zero Defect Zero Effect | Competitiveness intervention adoption tracking |
Enhanced with internal MIS data for richer operational detail while maintaining public data as the transparent baseline.
Key Outcomes the Cockpit Enables
For Secretary / Additional Secretary / Joint Secretary
Portfolio-Level Governance View
- Cross-scheme performance scorecard updated monthly/quarterly
- Strategic risk dashboard highlighting schemes needing intervention
- Budget utilization vs. outcome achievement comparison
- State rankings and inter-state performance benchmarking
For Scheme Directors & Program Managers
Operational Monitoring Dashboards
- Scheme-specific KPI tracking with target vs. actual visualization
- District-level drilldowns to identify implementation gaps
- Delivery pipeline status (approved → sanctioned → disbursed → completed)
- Data quality scoring to flag reliability issues
For Review & Audit Functions
Compliance-Ready Documentation
- Monthly “freeze and review” packs with automated generation
- Full data lineage and computation logic transparency
- Confidence labels indicating data quality and completeness
- Standardized KPI catalog with approved definitions
For Public Accountability
Optional Transparency Portal
- Public-facing dashboards powered by open datasets
- Citizen-accessible scheme performance metrics
- Geographic coverage maps and beneficiary statistics
- Secure separation between public view and internal operational layer
Implementation Roadmap
- Phase 0: Foundation (2–4 weeks)
- Phase 1: MVP Launch (8–12 weeks)
- Phase 2: Intelligence Layer (12–20 weeks)
- Phase 3: Advanced Analytics (20–36 weeks
Why This Approach Works
Data.gov.in-First Philosophy
- Transparency by design: Public datasets as baseline ensures accountability
- Rapid onboarding: Leverage existing open data infrastructure
- Auditability: Every metric traceable to authoritative source
- Citizen trust: Public can verify claims using same data
Standards-Driven
- Common KPI catalog ensures consistency across schemes
- LGD integration for accurate geographic mapping
- Reusable components for extending to new schemes
- Industry-standard tools for sustainability and skill availability
Results-Based Governance
- Outcome-focused metrics beyond just input and activity tracking
- Evidence-based decision making with data-driven insights
- Performance accountability at scheme and geography levels
- Continuous improvement through systematic monitoring
Success Metrics
Operational Efficiency
- 5-second response time for standard dashboard queries
- 90% automated refresh of all priority datasets
- Monthly review packs generated without manual intervention
- <24-hour alert notification for critical anomalies
Data Quality
- 95% completeness for priority datasets
- 100% lineage documentation for all computed metrics
- Quarterly data quality audits with published scorecards
Governance Impact
- 100% scheme coverage in portfolio view within Phase 1
- State and district drilldowns for geographic accountability
- Predictive accuracy >80% for delivery risk models (Phase 3)
Who This Serves
Ministry Leadership
Secretary, Additional Secretary, Joint Secretary requiring strategic oversight and portfolio-level governance intelligence
Program Directors
Scheme heads needing operational monitoring, bottleneck identification, and performance management tools
State Coordinators
State nodal officers tracking local implementation and comparing against peers
Monitoring & Evaluation Teams
Officers preparing review reports, audit responses, and outcome evaluations
Public & Researchers
Citizens and analysts accessing transparent performance data through the public portal
Get Started
Next Steps
Discovery Workshop
2-hour session to align on priority KPIs, data sources, and governance workflows
Technical Assessment
Review current data infrastructure, API access, and integration requirements
Pilot Launch
Phase 0 + Phase 1 delivery in 12 weeks with 2-3 priority schemes
Scale & Enhance
Expand coverage and analytics capabilities based on user feedback